Friday, April 25, 2014

Traffic Study Lab

The purpose of this lab is to determine the traffic frequency on a busy street in Macon, Georgia. This lab was done to not only show the amount of drivers driving on a road during a particular time period and the type of cars on the road but also the habits of drivers such as texting, driving,eating.

Materials:
1. a car
2. notebook
3. lab partner
4. a pencil

The method Alesia(my partner) and myself used to determine traffic frequency and our other data was by driving out to a busy thoroughfare. Specifically, we parked in the Zaxby's parking lot and watched cars driving on the 4 way stop in front of Zaxby's at 910 Riverside Dr, Macon, GA. These four roads of traffic were very busy during the time we went.Since the 4 roads had tons of cars, we decided to only look at the one of the street with the most cars. We decided to just focus on one of the streets because it was much easier to do so and we could see the outside and the inside of the cars better. There was also a traffic light, so this allowed us to take down data more effectively because the cars were not moving all the time. We decided to go during rush hour, when we knew it would be the busiest. We went at about 4:30 and stayed till about 5:00. So, we observed the traffic patterns on the street for 30 minutes. 30 minutes was a good time frame because it gave us enough data to make good conclusions. 


To effectively show our data, here is a chart:
Note: We also took down how many people were in each car and found that there were 110 cars with only 1 person, 24 cars with 2 people and 5 cars with more than 2 people.  


From this chart, it can be concluded that the amount of people driving SUV's and trucks was very high.Trucks were very popular. It can also be concluded that there are a lot of older drivers on the road probably because of the neighborhood. Furthermore, the amount of people talking or texting on the cellphone was also higher than expected while the number of people eating was characteristically low, which was expected.Also, the number of cars driving on this road in particular was very high because of the time period. Thereby, the frequency of cars on this road was high and it seemed as though every time the traffic lights stopped, more cars built up. We hypothesized that there was about 30 cars on the street every time there was a red light. 


Saturday, April 19, 2014

Mitochondrial Eve and DNA

Scientists and geneticists have all identified the maternal, common ancestor of all human beings around the world. This ancestor is a women and she is "Mitochondrial Eve". She lived around 200, 000 years ago as it is said. She is also said to have African origin and consequently all human beings can be traced back to Africa. The idea of this Mitochondrial eve came from the concept of mitochondrial DNA. Mitochondria is an energy producing organelle that has its own distinctive DNA. Each mitochondria with about 1,700 in every human cell includes an identical loop of DNA about 16,000 base pairs long containing 37 genes. However, mtDNA or mitochondrial DNA is passed on only along the maternal line. So, all of the mitochondrial DNA in a persons body is from his/ her mother and this process continues on.Furthermore,the mitochondrial DNA gets transfered from generation to generation without any recombination, which is way different from DNA in the nucleus.This allows DNA in the mitochondria to have a normal replication rate without random mutations.Therefore, the link between mitochondrial DNA and mitochondrial eve can be established because mtDNA is only transferred via the maternal line and mitochrondrial eve is a women. Mitochondrial Eve and mtDNA have both shown that there are many genetic similarities between human beings and we all can trace our lineage back to Africa no matter where we have migrated to or live in today. 

 Chinese women- Harajuku culture


 Igbo women of Nigeria


 Saudi Arabian women


 Brazilian women


 Men from India


Plants Lab


Redwood tree (Sequoia sempervirens)- The Redwoods are confers and some of the tallest tress in the world. averaging eight feet to 20 feet in diameter and can be as tall as 300 feet or more. The tallest redwood tree in the world is named Hyperion and reaches 379.7 feet. They have a very long lifespan living up to 2,000 years. They also have a long history, as they showed up on Earth shortly after the dinosaurs and have been around for more than 240 million years. Though they once thrived in all parts of the United States, redwoods are mostly found on the coast from central California to southern oregon.The common names for redwoods are Coast redwoodCalifornia redwoodGod trees and Giant redwood. The coastal redwood is the most abundant and the biggest. The coast redwoods need a moderate coast type environment to survive with abundant rainfall. All of the redwoods can be identified by the distinctive reddish- brown color to their thick bark.


Magnolia (Magnoliaceae)- The Magnolia tree is comprised in large genus of about 210 flowering plants species. Magnolias are named after French botanist Pierre Magnol. Magnolia trees originate from Southeast Asia and North America but they are known around the world for their beauty.they are ancient plants and have existed on the planet for about 95 million years. Magnolia trees usually grow in acidic soils that are rich in nutrients and in areas that provide enough moisture and direct sunlight.Magnolias have dark green, oval shaped leaves that are covered with layer of wax making for a leathery texture.Magnolias have distinctive flowers about 1- 3 inches wide with fused petals and sepals and the flowers a most- often a white or pinkish color.They do not produce nectar but have pollen enriched with proteins that attract bees.


Weeping Willow(Salix babylonica)-The weeping willow is a large deciduous tree with long, drooping
 branches.These branches are characteristic of these trees and weeping willows are recognized because 
of their canopy type appearance. The branches of the tree will droop down over the ground to create a sort- of curtain around the base of the tree. In the spring, the tree is covered in bright-yellow flowers. The tree is often found around water sources.The weeping willow tree grows best in areas with a lot of natural moisture and it thrives with alot of sun exposure. It can withstand almost any soil type. Weeping willows have large root structures, so they are usually found or planted in places where pavement, cement or foundation and plumbing do not get in the way of their growth.Weeping willows are mainly used for ornamental purposes and shade. 


Lilac shrub(Syringa)- Syringa is a genus of 20-25 species in the olive family- Oleaceae. Lilacs are deciduous, grow as medium to large shrubs or small tree and reach a height of about 4 to 20 feet.The leaves on lilac shrubs are cordate, or heart-shaped. Lilac flowers are fragrant and range in color from white to the characteristic dark purple color.Lilacs have pyramidal clusters of flowers. Lilacs are native to Eastern Europe and Asia and were brought by colonists to america in the 17th century.  A fun fact about lilacs is that they symbolize love and it is strongly associated with the holiday Easter.


Honeysuckle shrub(Lonicera)- Honeysuckles are arching shrubs or twining vines in the family Caprifoliaceae. They are native to the Northern Hemisphere with about 180 species with most being found in China.They bloom in spring to midsummer. Many of the species have sweetly-scented, bilaterally symmetrical flowers or trumpet shaped flowers that produce a sweet, very fragrant and edible nectar. Honeysuckles attract hummingbirds and butterflies to their nectar. Some strains of honeysuckle are becoming an invasive species in the United States but they are still valued as garden plants such as the shrub form or the winter honeysuckle make good hedges and screens.

Sunday, March 30, 2014

Mapping lab

A Choropleth map is a type of thematic map, where areas are shaded or patterned in proportion to the variables being displayed usually to indicate the average quantity or values in those areas.In this type of map, a dark color typically means more and a light color means less.


A dot density map is another type of thematic map that shows the geographic distribution of phenomena using an arrangement of symbols. The symbols used are most commonly dots. The dot density map is one of the primary techniques for representing geographic patterns that is used today.


A proportional symbol map is another type of thematic map, where data is displayed on these maps with proportionally sized symbols to show differences in occurrences and the data values found at each location. These symbols are usually circles but can also be squares and other shapes. 

An isarithmic map can fall into a couple of categories which include topographic, weather and bathymetric map types. An isarithmic map is also known as a contour map or an isopleth map and depicts smooth, continuous phenomena such as precipitation, elevation or temperature. Each line or curve bounded area in an isarithmic map represents a region with the same value.


Contour lines for Stone Mountain, Georgia

Wednesday, March 26, 2014

Dendochronology Lab

The purpose of this lab: was to determine the relative age of a tree by counting the number of tree rings present on the tree.The tree rings represented the xylem of the tree This lab was also done to figure out weather conditions such as rainfall and temperature along with events that would have occurred as the tree grew and the number of tree rings increased. This lab was also a a way to do hindcasting using dendochronology.

Elm Tree Sample from Palm Springs, California, specifically from the San, Hasento Mountain Range, with a desert soil type and a hot, dry climate
By counting the tree rings in the picture, this tree is estimated to be around 30-35 years old. 
Pine tree Sample from Macon, Georgia
By counting the tree rings in the picture, this tree is estimated to be around 50-55 years old.This tree also seems to very healthy as the inner tree rings are darker in color and more defined showing that it survived in pretty favorable weather conditions.

Note:
Based the observations I made by looking at the photos of the tree rings, the tree rings are somewhat uneven and jarred at the edges in both pictures. The reason the outer rings are misshapen is because of how the tree was cut. The blades of the saw during the cutting process were maybe not consistently moved or too unstable to make a clean cut. On further observation of the tree rings, the inner rings seemed to be quite narrower than the outer rings. A reason for this narrowness could be the presence of a drought or another weather event that prevented the tree from getting enough water.


Next, in order to truly understand how the trees lived, the climate conditions and thickness of the tree rings found in Palm Springs and Macon, Georgia have to be examined dating back to 1960's in intervals of 5 years.The rough average temperature of Georgia was about 79 degrees and the average temperature of Pal Springs was about 91 degrees. The average thickness of the tree rings in Georgia ranged from the lowest being 0.13 to the highest at 2.42. The tree ring thickness in Palm Springs was much less varied with the lowest being 0.29 and the highest being 1.17.

Here is a chart for reference: 


Here is an XY scatter plot to show whether or whether not there is a correlation between tree ring thickness and temperature:

This scatter plot shows that there is a huge difference in temperatures between the two trees because they are located in two different climate conditions. However, both trees from the different areas are pretty matched in their tree ring thickness and this shows that temperature did not have a huge effect on the tree rings of these tress. However, it can be noted that in most circumstances, warmer temperatures usually make trees grow better.


Lastly, these two tree samples also represent a much greater idea in terms the environment that the trees lived in. Many major events happened during the growth of these two trees.

Here are two pictures of the tree samples along with major historical events superimposed on them to show that trees can withstand the test of time and live through almost anything including catastrophic events.


To conclude:There is a lot that can be learned from this lab. It is a wonder how tree rings can be such a great indicator of so many things like climate, precipitation and even soil conditions. It is also amazing how tress have such a long lifespan and are not affected very easily because of their strength and resilience.


Sunday, March 16, 2014

Rocks + Soils Lab

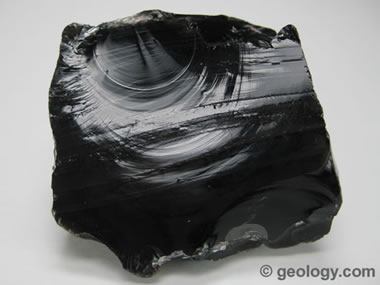
Obsidian- is an extrusive, igneous rock that forms when molten rock material cools so rapidly that atoms are unable to arrange themselves into a crystalline structure.It has a smooth uniform texture. It is usually the color black but it can also be seen with a brown or green type color or even multiple colors  caused by light reflecting from minute inclusions of mineral crystals, rock debris or gas. This is called "Rainbow obsidian" caused by light reflecting from minute inclusions of mineral crystals, rock debris or gas. Here's a picture of this specific type of obsidian.
http://geology.com/rocks/obsidian.shtml
http://www.stonecontact.com/products-229350/rainbow-obsidian-rough
This is a picture of the Marble Caves that are located on the border of Chile and Argentina. These caves are purely made of marble and are one the most beautiful places on earth. There is no other place in the world that has a structure like this completely made of marble. Marble is a metamorphic rock. It is of metamorphosed limestone composition. Marble comes in many different colors. The color of the marble is determined by it's mineral composition during formation and what impurities are present in the limestone during the crystallization process.
http://www.travelingmyself.com/2013/04/28/marble-caves-chile-lago-general-carrera-lake-patagonia/
http://www.ethosmarblecare.co.uk/stonecleaning/marble-restoration-polishing.shtml
This is an example of a sedimentary rock formation.This picture shows the honeycomb weathering at Elgol, Scotland, looking towards the
Cuillins on Skye beach. This honeycomb structure resembles bones.It s beleived that this structure is a result of salt weathering, where salty water percolates through the pore spaces of rocks and evaporates at the surface,disaggregates the grains and break up the clay and cement that holds them together becoming more and more aggressive.The honeycomb weathering is made up of sandstone, which is a type of sedimentary rock.Sandstone is composed of small, sand- sized grains of mineral, rock or organic material. These small grains are created by weathering and transportation caused by moving water, wind or even ice. Sandstone is one of the most common types of sedimentary rock. It is mined for construction material or as a raw material used in manufacturing or even serves as an aquifer for ground water or as a reservoir for oil and natural gas.
http://www.geopoem.com/2013/03/stone-lace.html
http://geology.com/rocks/sandstone.shtml


12 Soil Types of the World
http://www.cals.uidaho.edu/soilorders/orders.htm

Soil Triangle
 The soil diagram is one of the ways we look at soil. This triangle helps to determine types of soil particles.

Homemade Barometer lab


This lab was necessary to learn how to measure barometric pressure by making a homemade barometer.


This lab also allowed work with Microsoft Excel to make a professionally, appealing graph and table.


                                             Calibration of Homemade Barometer
                                              Atmospheric Pressure(ATM)                           Ruler Reading(mm)
                                                                                         0.90                                                          15
0.95 20
1 25
1.05 30